In my third blog “clinical reasoning! But how?” we looked at what clinical reasoning really is. Now let’s zoom in a bit on our physical examination and find out what does a “special” test tell me when it is either positive, or negative.
Sensitivity and specificity
Remember these? We got drilled to believe that these are important and that the higher % they have got the better it is, right?
A small refreshing course:
“In medical diagnosis, test sensitivity is the ability of a test to correctly identify those with the disease (true positive rate). Whereas test specificity is the ability of the test to correctly identify those without the disease (true negative rate).”
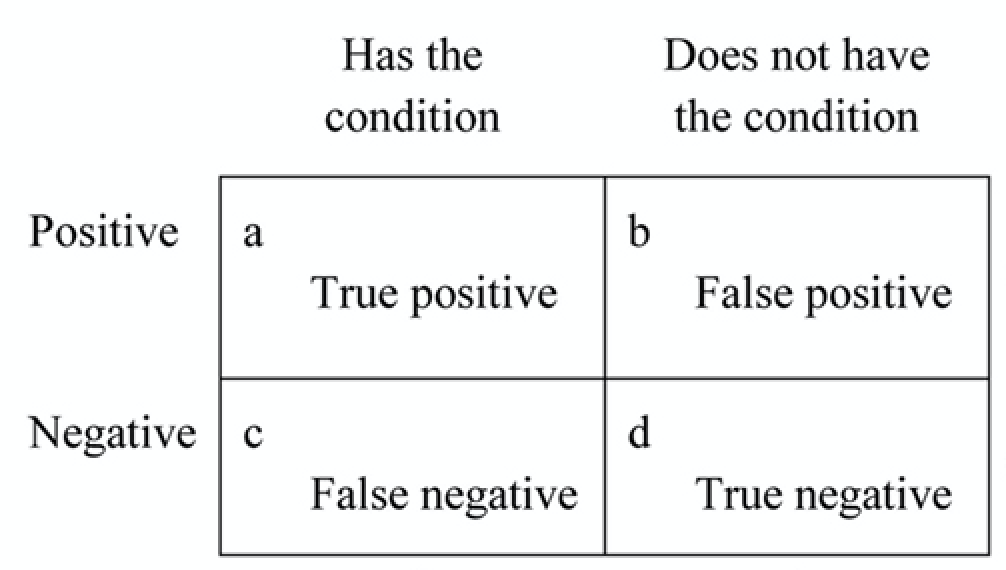
We can calculate the sensitivity by dividing the true positives (a) by the total amount of people that have the condition (a+c). Or a/(a+c). The same is true for the specificity b/(b+d).
Got your memory back a little? Okay here is where it gets tricky. Although in research sensitivity and specificity are important and good to know, they help me less while we are performing our physical exam with our patient.
Useful?
Why? Let’s say we have a sensitivity of 78%, which is a pretty good test, but still 22% of the times when I have a positive test I am diagnosing something that is not there. The problem is when the patient is in front of me I do not know if he or she belongs to the 78% or the 22%. So rather than using sensitivity and specificity I like to use +LR or positive likelihood ratio and -LR negative likelihood ratio. These likelihood ratios give me an increase or decrease probability after a positive or negative outcome from my clinical test. Confused? Don’t worry.
Prevalence
Take a step back. Back in my previous blog, I explained that we reason our way to our tests. Then we have tests to confirm or rule out our suspicion of a pathology. It helps to know the prevalence of a certain pathology in a certain group of patients. So let’s say 30 year old male with shoulder pain comes in. I know that cuff ruptures occur in 33% (fictional nr.) of the population with shoulder pain and had a trauma. I now want to do my special tests to confirm my suspicion of a cuff tear. With my +LR I can increase that 33% (or 1 patient out of 3) if my test is positive.
+LR and -LR
So what are these magical likelihood ratios I am talking about?
Positive likelihood ratio: ratio between the probability of a positive test result given the presence of the disease and the probability of a positive test result given the absence of the disease.
= True positive rate / False positive rate = Sensitivity / (1-Specificity).Negative likelihood ratio: ratio between the probability of a negative test result given the presence of the disease and the probability of a negative test result given the absence of the disease, i.e.
= False negative rate / True negative rate = (1-Sensitivity) / Specificity.
For the +LR we want to see a number higher than 1, the higher this number is, the higher the % of change in probability. For the -LR we want a number between 0 and 1. Where 0,1 is the highest change in probability and 1 is a 0% decrease change in probability. So it tells us nothing. A paper from Mcgee S. (2002)[1] put a percentage increase or decrease by carious LR outcomes shown in table 2.
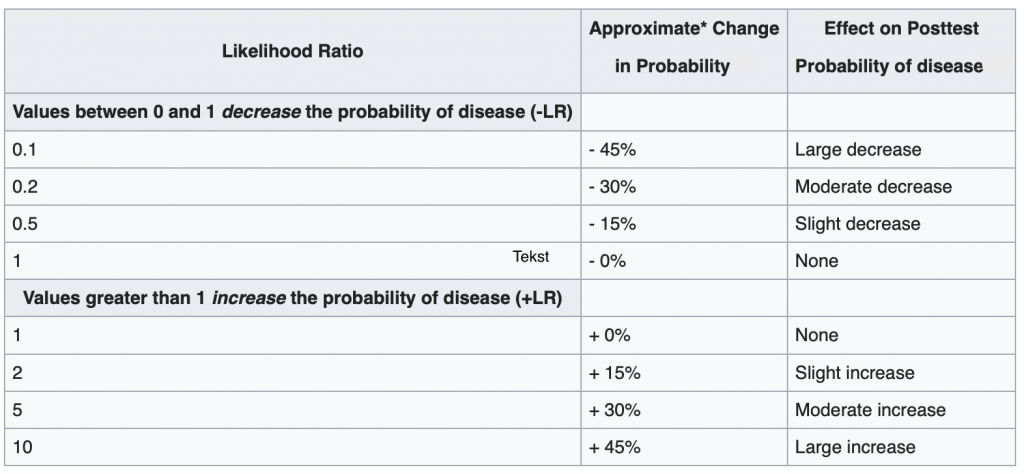
So a +LR of 2 increases my chances by 15% and 5 30% etc..
What to do with this information?
I know that 1 in 3 of the patients with shoulder pain who had a trauma, has a cuff rupture (fictional, not real data). We did the external rotation lag sign, which is described for full thickness rupture of the supraspinatus and infraspinatus tendon with a +LR 5 according to hegedes et al. [2]. The test is positive, so now my 33% pre test likelihood changed to 33% + 30% = 63%. So rather than thinking that my positive test result tells me wether the pathology is there or not, I can tell my patient there is a 63% chance that you have a cuff tear. To confirm this we might want to send you in for ultrasound imaging or an MRI.
References
- Mcgee S. Simplifying likelihood ratios. J. gen. Intern. Med. 2002 aug. 17(8)
- Hegedus EJ, Goode AP, Cook CE, Michener L, Myer CA, Myer DM, Wright AA. Which physical examination tests provide clinicians with the most value when examining the shoulder? Update of a systematic review with meta-analysis of individual tests. British J. Sports Med. 2012 Nov; 46(14):964-78.